>

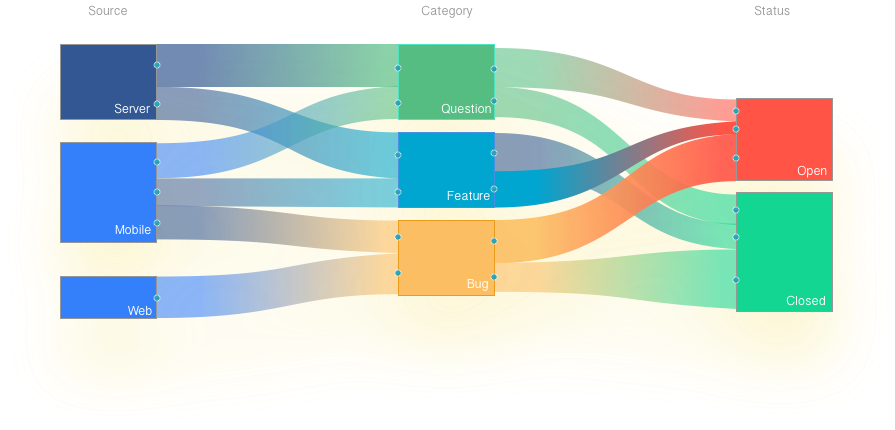
Understand the connections in your data

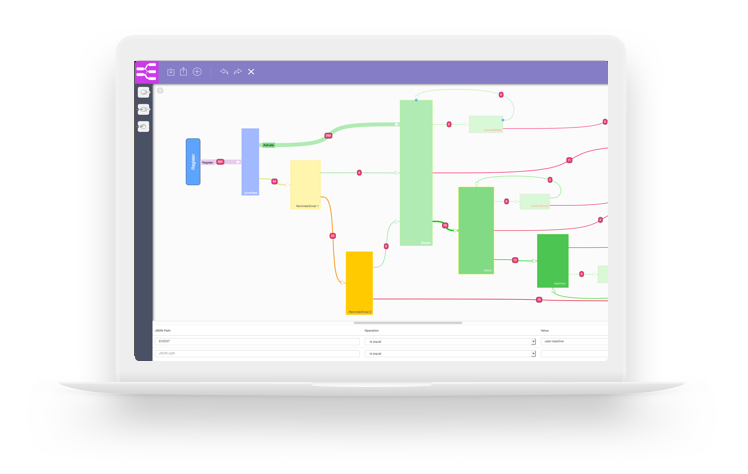
Sankey state helps to understand and visualize your transaction data through a simple web-based interface.

About
Sankey Diagram - A Powerful Chart Type
Sankey Diagram is used to visualize the magnitude of flow between states in ordered analysis.Traditionally used to visualize the flow of energy or materials in various networks and processes.

They illustrate quantitative information about flows, their relationships, and their transformation. Sankey diagrams represent directed, weighted graphs with weight functions that satisfy flow conservation: the sum of the incoming weights for each node is equal to its outgoing weights.
Use Cases
Learn how people use your app with your customized sankey diagrams
Understanding what your users are doing doesn’t have to be a complicated setup process. Once you install the Sankey NodeJS server, you can pick and choose which actions to track in your app.
Have you ever wanted to know if people used the comment feature or tapped that button in your app? Just point and click to choose the interactions you want to measure. Now you can spend more time learning how to make your app better.

  • Phone registration failures over specific period
  • Tracking transaction payment processing platform
  • Tracking a renewal or new signup transaction
  • E-Commerce: typical user session, anomalous checkout transactions, catching drop off in checkout
  • Tracking users on-boarding process
  • Attribution modeling - Determining the origin of a user action
Learn something surprising about your users
Use webhooks to integrate data events
Integrate any app or server via webhooks in less than 5 minutes
Getting started example
Track the success of your registration process
We want monitor the simple user registration process shown below as an getting started example.

1.) Requirements

In order to run the Sankey state server your need NodeJS and a running postgres DB.

2.) Installing Sankey state

Just install the server with the NodeJS package manager or go to Github if you want to build it by your own via grunt.
npm install sankey-report

3.) Set the enviroment variable for the PostgresDB

The sankey server uses Postgres for the persistence. You must configure the connection string with an enviroment variable.
export DATABASE_URL=postgres://postgres:@localhost:5432/sankey

4.) Start the Sankey state server

Now you can stat the server and if everything is fine it reports the URL where you can reach the administration UI.
>sankey-report [enter]
Serve directory "/Users/freegroup/draw2d_js.app.sankey_report/server"
Admin UI: on http://10.87.155.238:6800/editor
WebHook URL: on http://10.87.155.238:6800/backend/hook                     
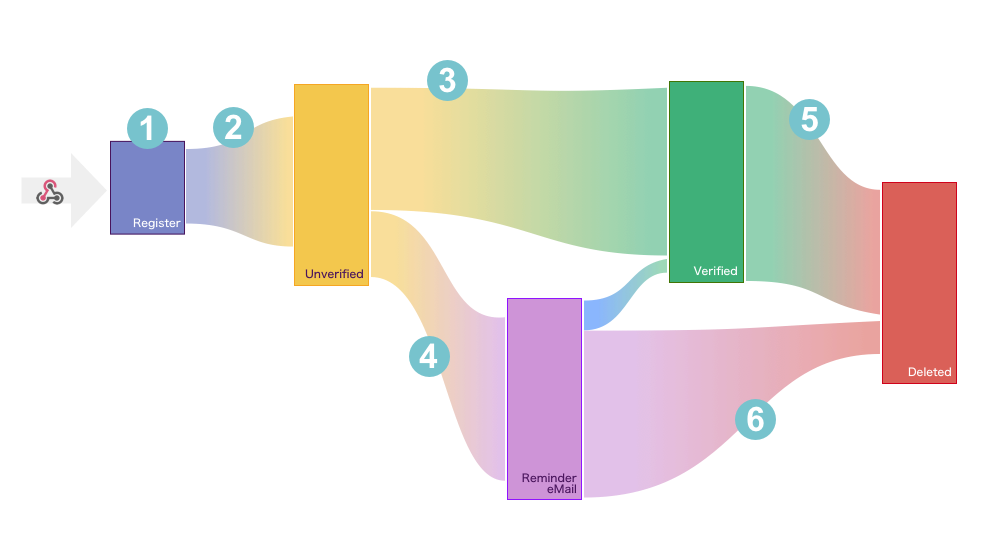
5.) Plump your diagram

Open the adminstration UI and create the example diagram shown below. Just play the video to see how to plump the diagram. Don't forget to save your diagram if you are done.

6.) POST some JSON to the WebHook URL

Post the JSON sequence below and you can see in realtime the increment of the connection weights.

Send this JSON if a user has registed in your App
{
   "id" : 42
   "event":"user:create",
   "type":"User",
   "content":{
       "name": "John Doe",
       "email": "john@doe.com"
   }
}
                        

Send this from your App if the User has verified the eMail address
{
   "id" : 42
   "event":"user:verified",
   "type":"User",
   "content":{
       "name": "John Doe",
       "email": "john@doe.com"
   }
}
                        

Send this JSON if the user (or the system) has deleted the account
{
   "id" : 42
   "event":"user:deleted",
   "type":"User",
   "content":{
       "name": "John Doe",
       "email": "john@doe.com"
   }
}
                        
Now you has send the events to the WebHook and the diagram reflects the flow of one user registration.